
Enhanced Metagenomic Deep Learning for Disease Prediction and Reproducible Signature Identification by Restructured Microbiome 2D-Representations
Published in Patterns, 2022
Recommended citation: Shen W X, Liang S R, Jiang Y Y, et al. Enhanced metagenomic deep learning for disease prediction and consistent signature recognition by restructured microbiome 2D representations[J]. Patterns, 2023, 4(1): 100658. https://www.cell.com/patterns/fulltext/S2666-3899(22)00298-7
2D-Representations of metagenomic data
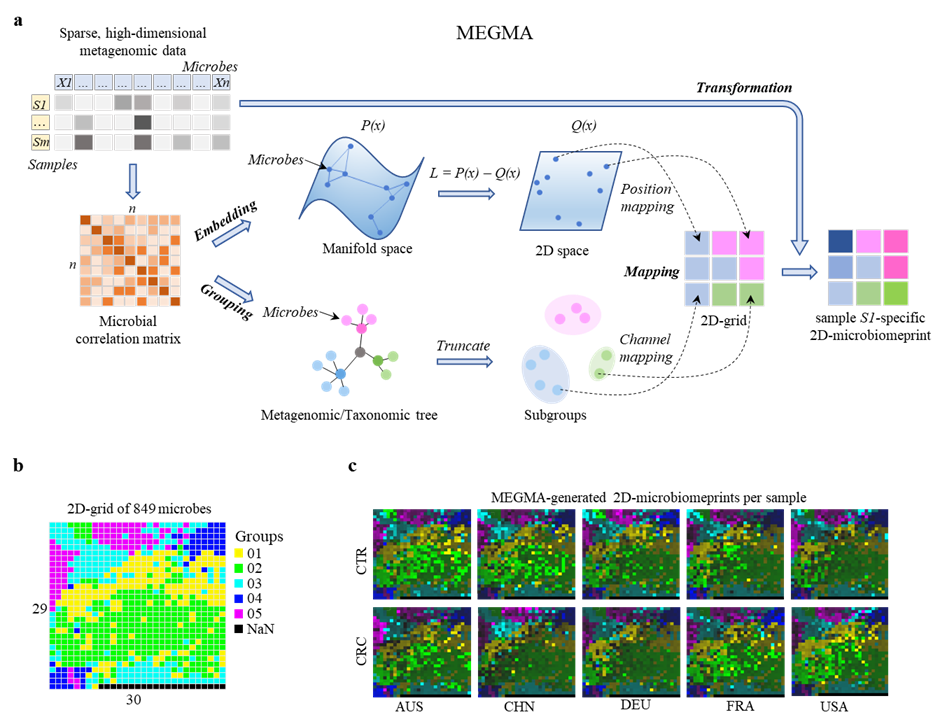
Generation of personal image-like multichannel 2D-microbiomeprint by MEGMA. a, flowchart of the metagenomic Microbial Embedding, Grouping,and Mapping Algorthm (MEGMA). The input is the sparse, high-dimensional metagenomic tabular data with logarithm transformed, then the pairwise correlation matrix of the microbes is calculated. The embedding and grouping are based on the correlation matrix (except for the taxonomic-based grouping). In the Embedding stage, each microbe will get the x and y coordinates in the 2D space by manifold learning algorithms. In the Grouping stage, the host microbes are grouped into several subgroups by truncating the metagenomic hierarchical clustering tree or taxonomic phylogenetic tree. In the Mapping stage, the position mapping is response for the assignment of each microbe to one optimized position in the 2D-grid map, while the channel mapping is to split the microbes into different channels based on the subgroups. Finally, in the MEGMA Transformation stage, the species abundance vector of one sample is then transformed into individual-specific multichannel image-like 2D-microbiomeprint based on the species locations in the regular 2D-grid. Each pixel in the 2D-microbiomeprint represents one species (or operational taxonomic units, OTU) of microbe, and each color (group) is one channel, the brightness of the color represents the magnitude of the abundance value. b, the MEGMA-generated grid map of the 849 microbial species in CRC-Nation data (i. e., each pixel is one microbial species), the number of the cluster channel is 5, the size of the regular 2D-gird map is (29, 30). c, the MEGMA-generated multi-channel 2D signatures (transformed from the 2D grid map in b) for a CRC patient and a CTR individual in each of the five nations of AUS: Australia, CHN: China, DEU: Germany, FRA: France, USA: America.